Hermes Agent Dashboard Setup: SSH, Caddy, Docker & Security (2026)
Run the Hermes Agent web dashboard on your VPS with SSH tunneling, Caddy reverse proxy, Docker, or systemd. Includes Basic Auth config and security risks of exposing AI agents.

If you are running Hermes Agent on a VPS and want a browser-based way to manage sessions, API keys, memory, and configuration, the built-in dashboard does exactly that. As of v0.16 (June 2026), the dashboard ships as a native browser admin panel. It is a single command away, but the default setup only listens on localhost. This guide covers how to run it locally, access it remotely via SSH tunnel or through a Caddy reverse proxy with password protection, deploy it in Docker, and keep it running permanently with systemd.
Hermes Agent GitHubWhat this guide covers
- Starting the Hermes dashboard locally and on a remote server
- Remote access via SSH port forwarding (simplest and safest)
- Exposing it externally with Caddy reverse proxy
- Adding Basic Auth with a username and password
- Running it permanently with systemd or Docker
- Security risks you should know about
What the Hermes dashboard does
The dashboard gives you a browser interface for managing your Hermes Agent instance. From it you can:
- View and manage active chat sessions
- Browse and edit agent memory files
- Configure API keys and model settings
- Monitor token usage and costs
- Manage skills and tool configurations
It connects to the existing Hermes gateway process that is already running on your server — it does not start a second agent.
Dashboard tour
Once the dashboard is running, the top navigation bar gives you access to several tabs. Here is what each one shows.
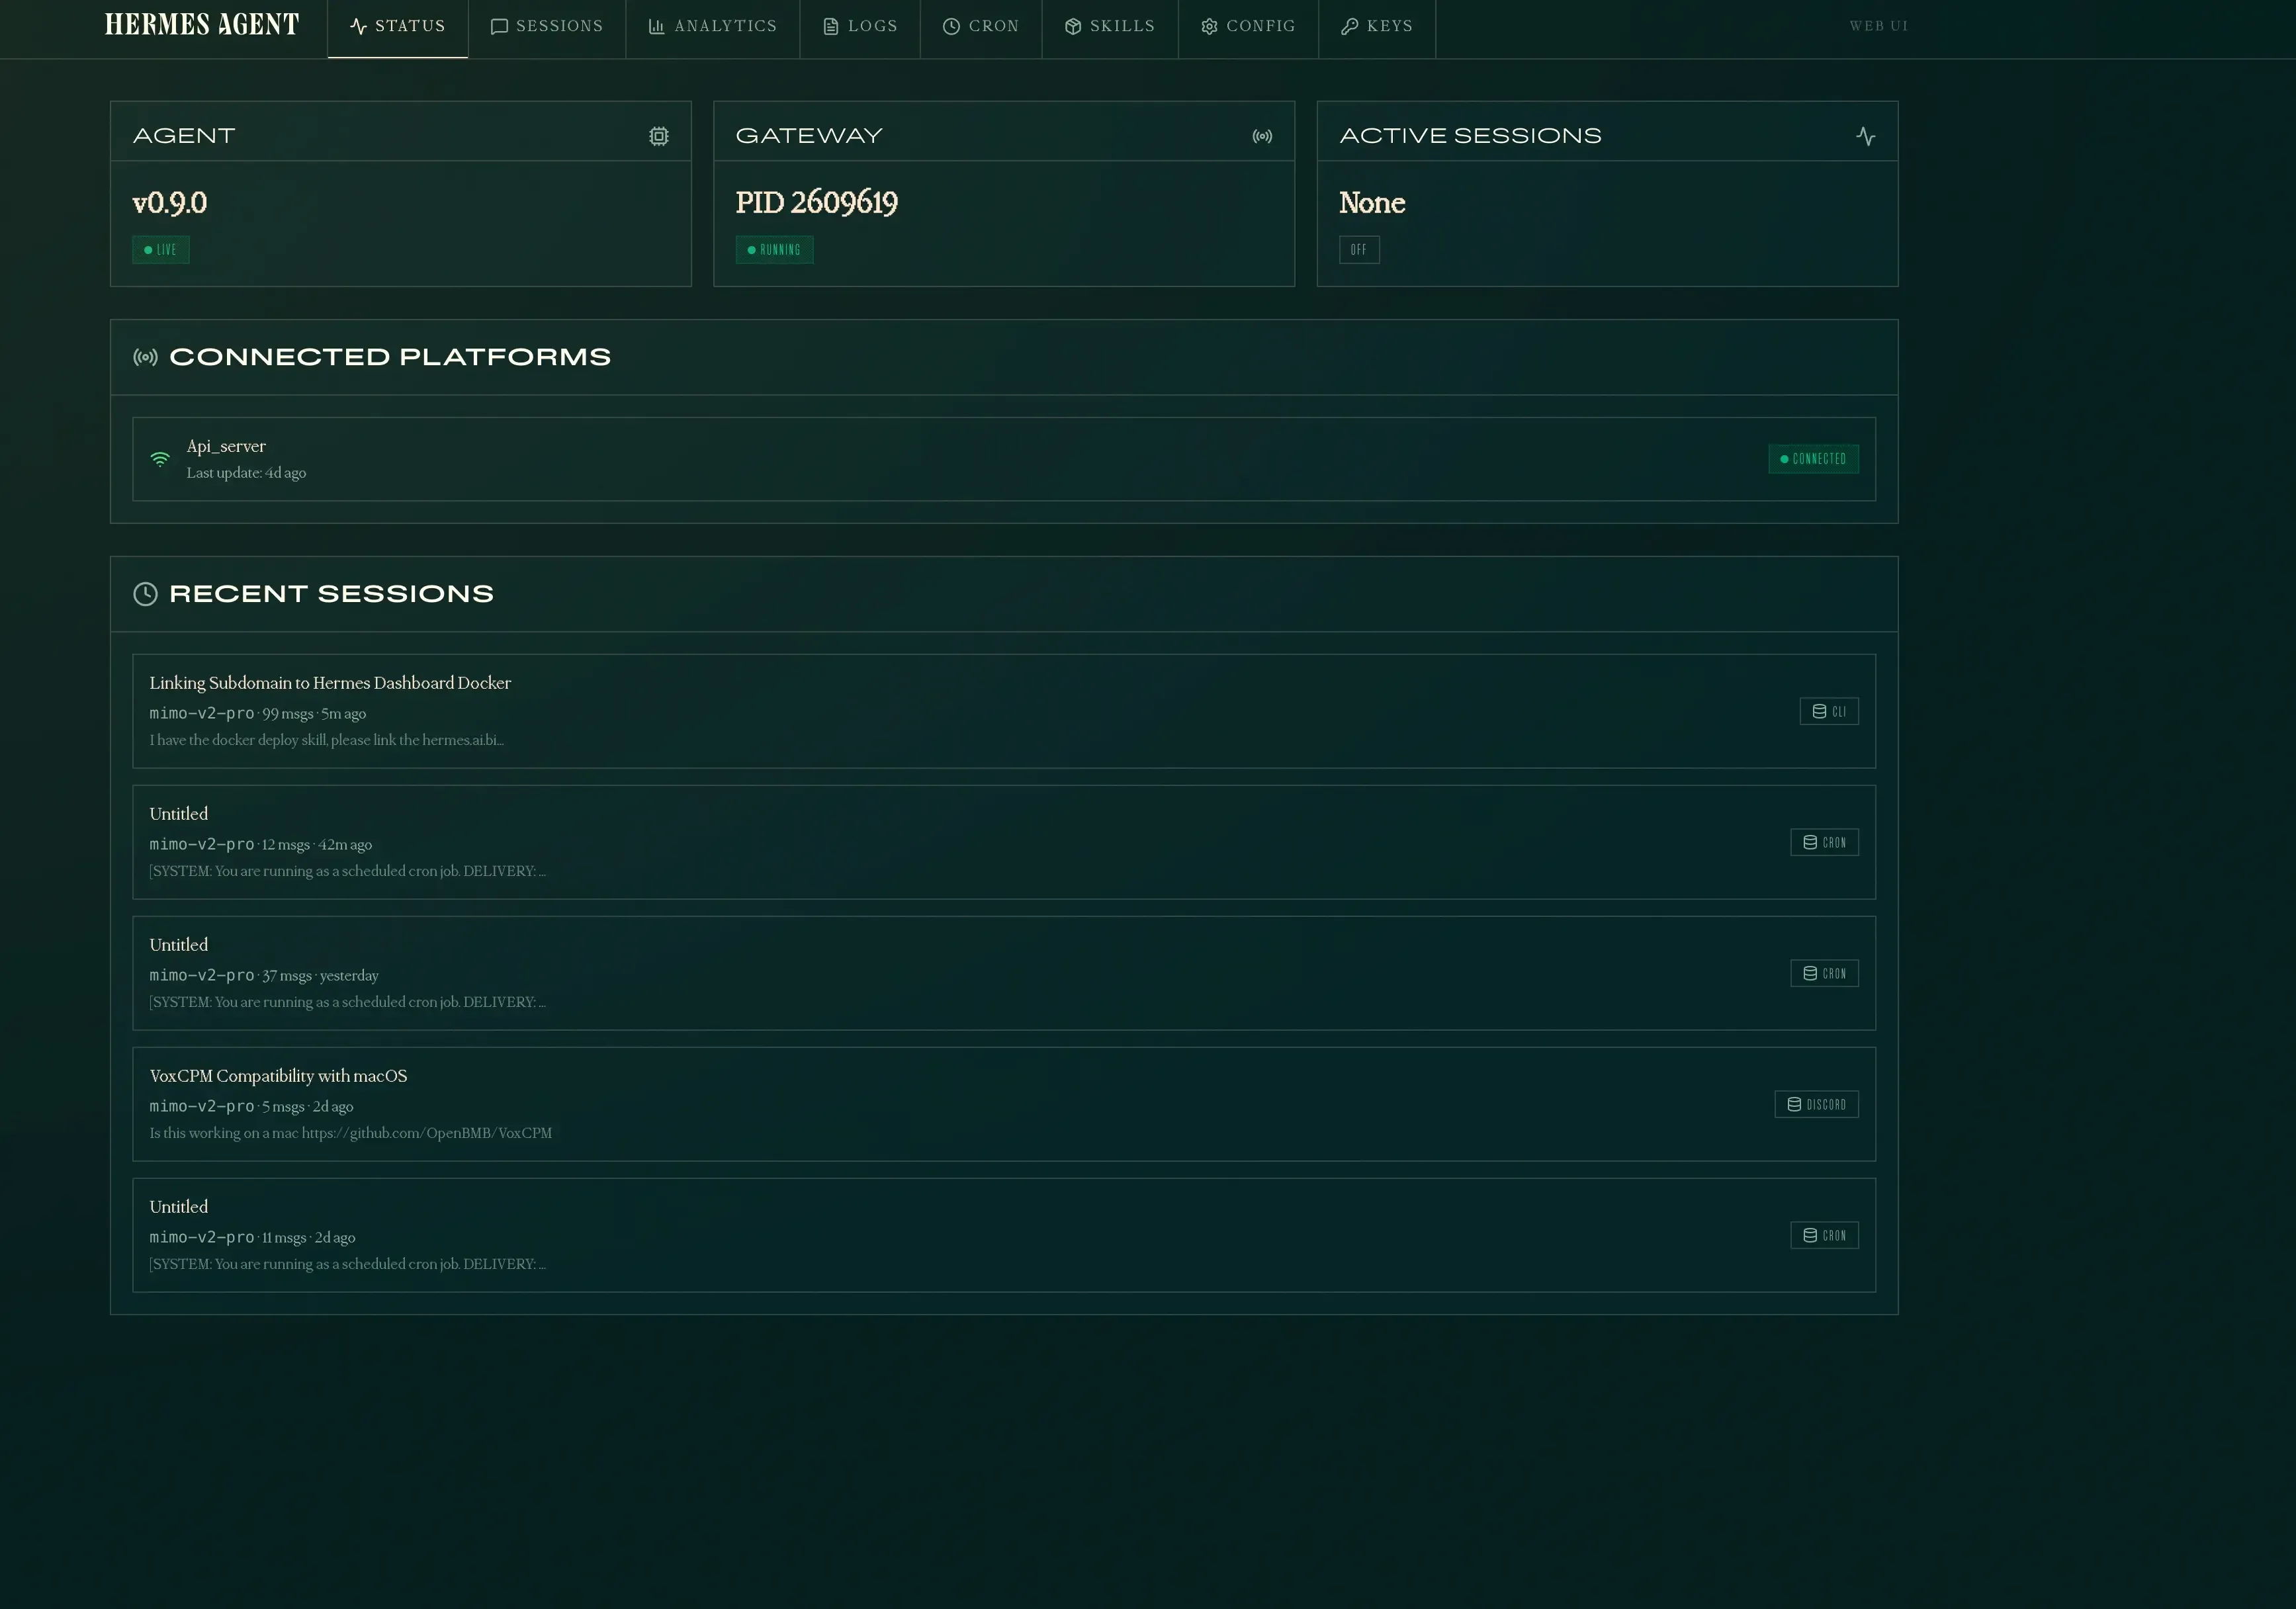
Status
The Status tab is the landing page. It shows whether the agent and gateway are running, connected platforms, and a list of recent sessions with message counts and previews.
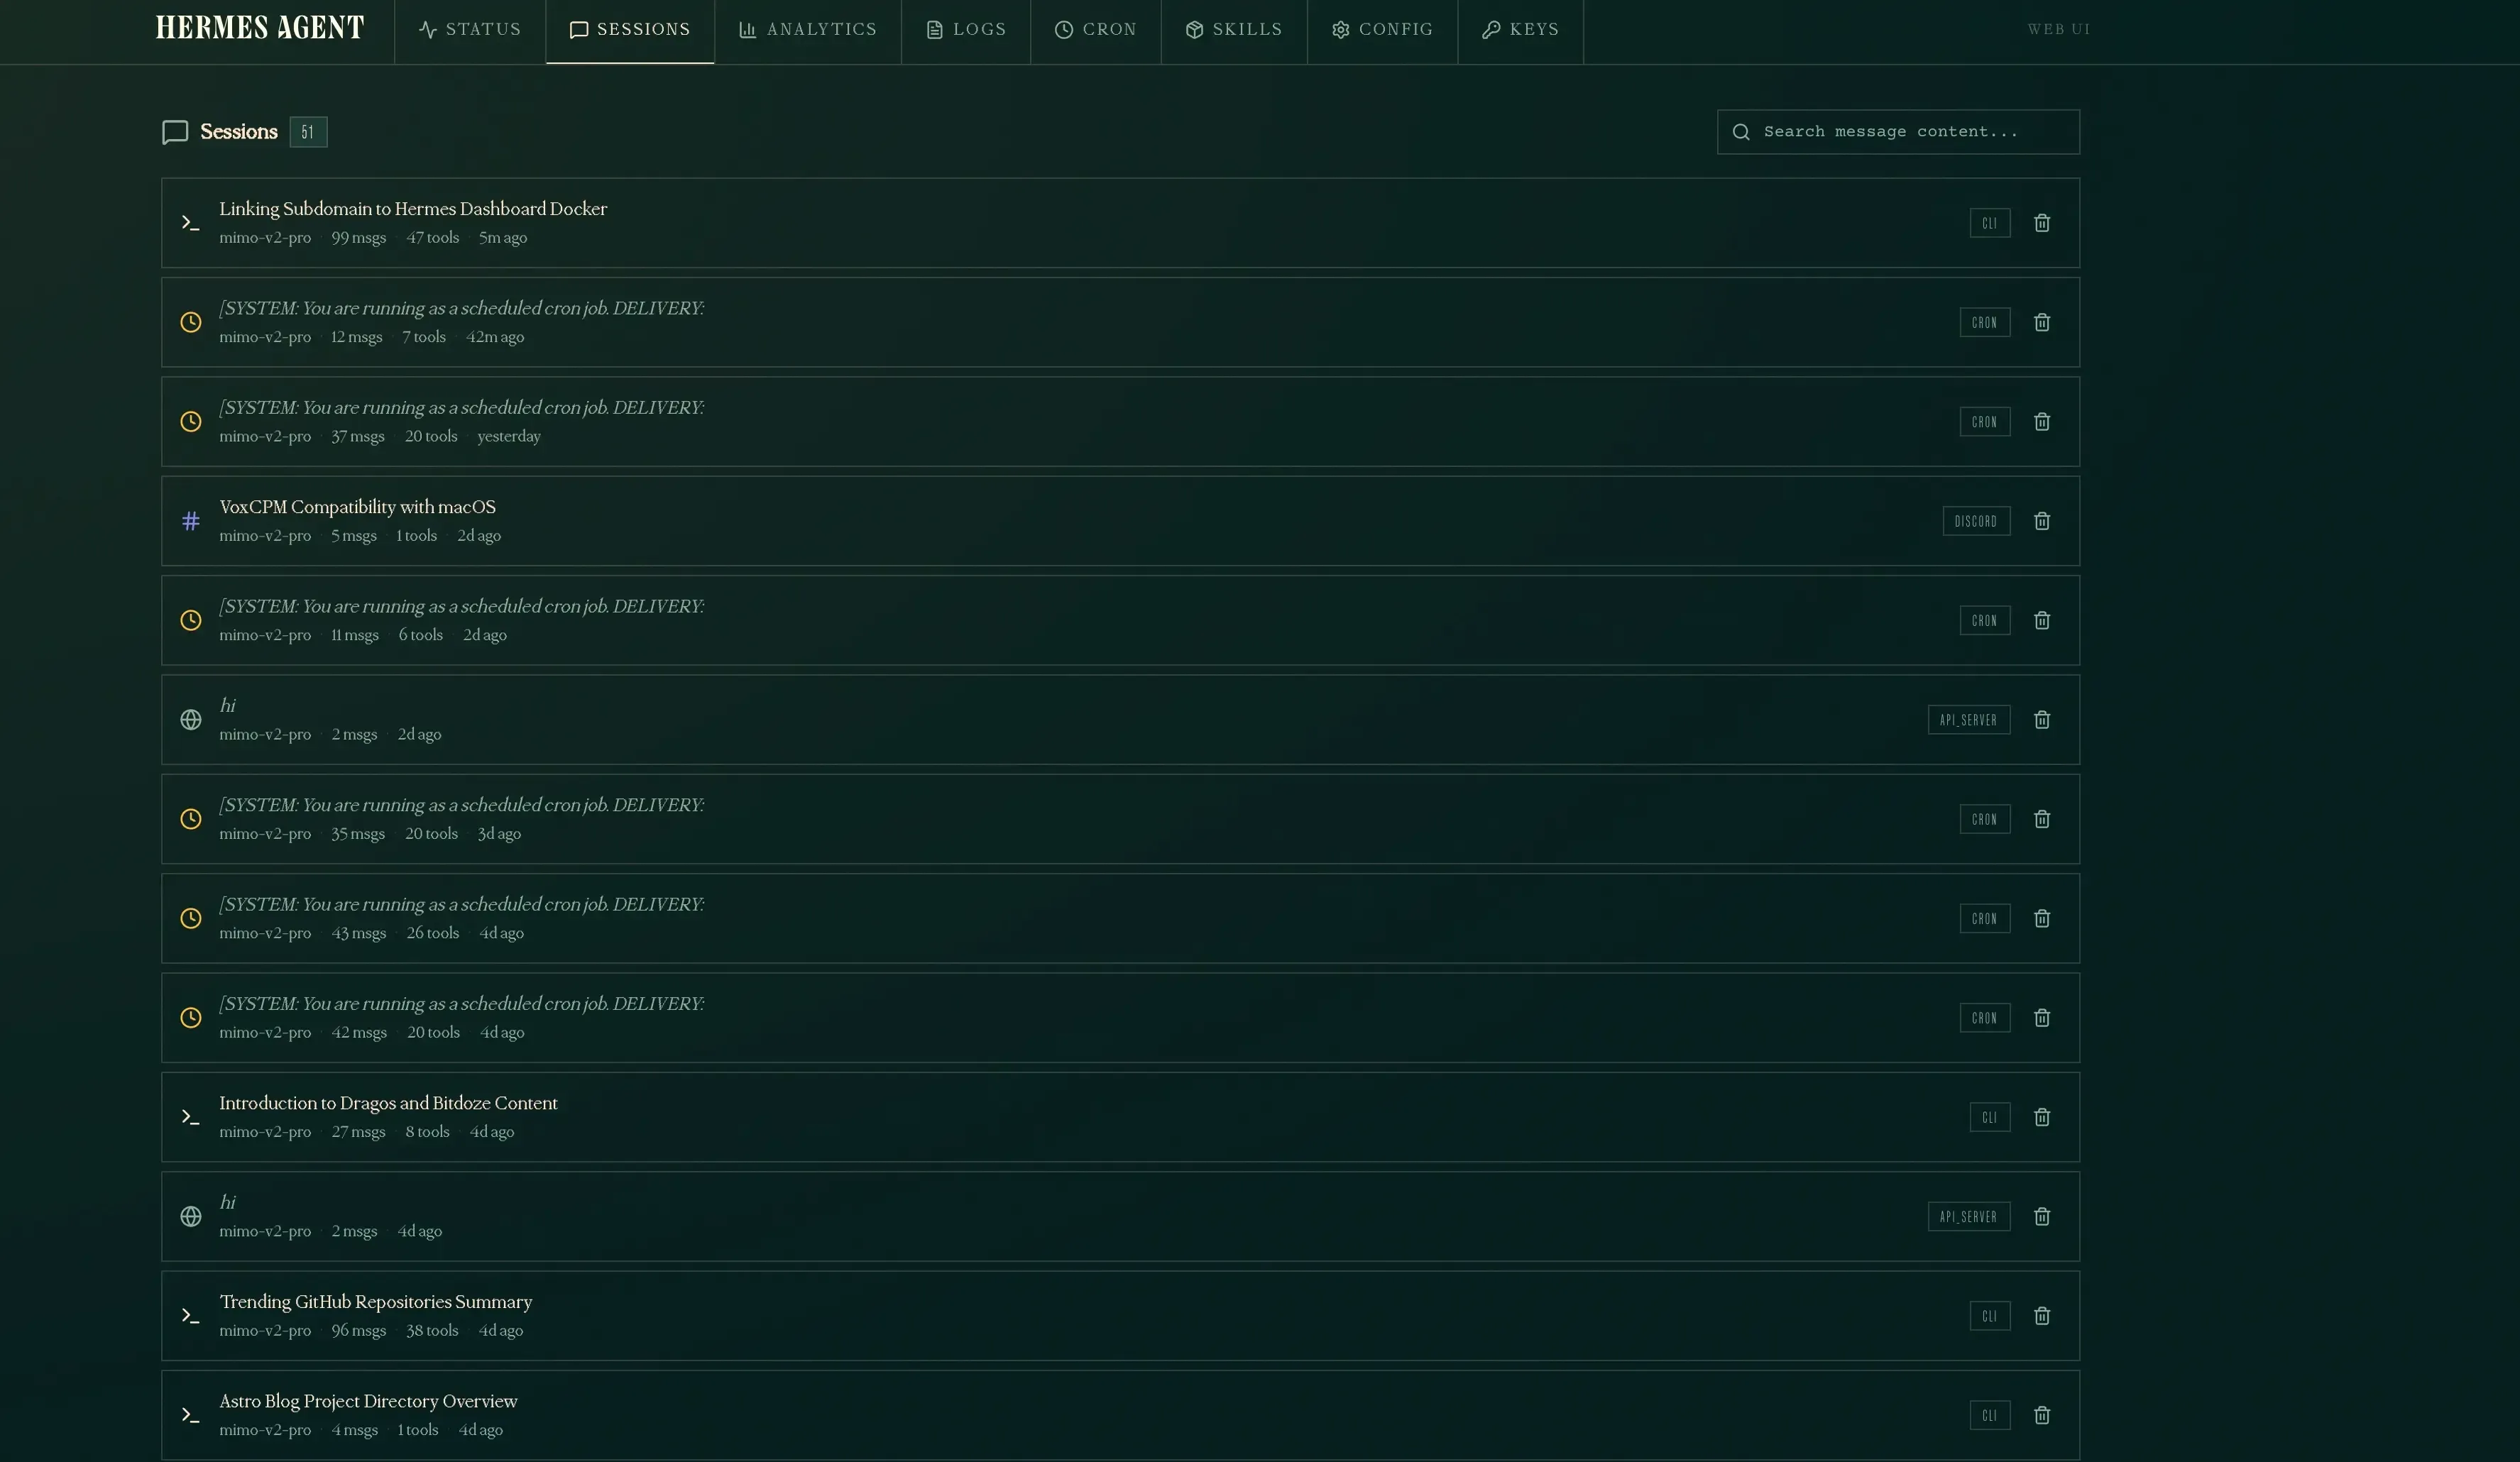
Sessions
The Sessions tab lists all past and active sessions. Each entry shows the model used, message count, tools called, and when it was last active. You can search message content across all sessions and delete old ones.
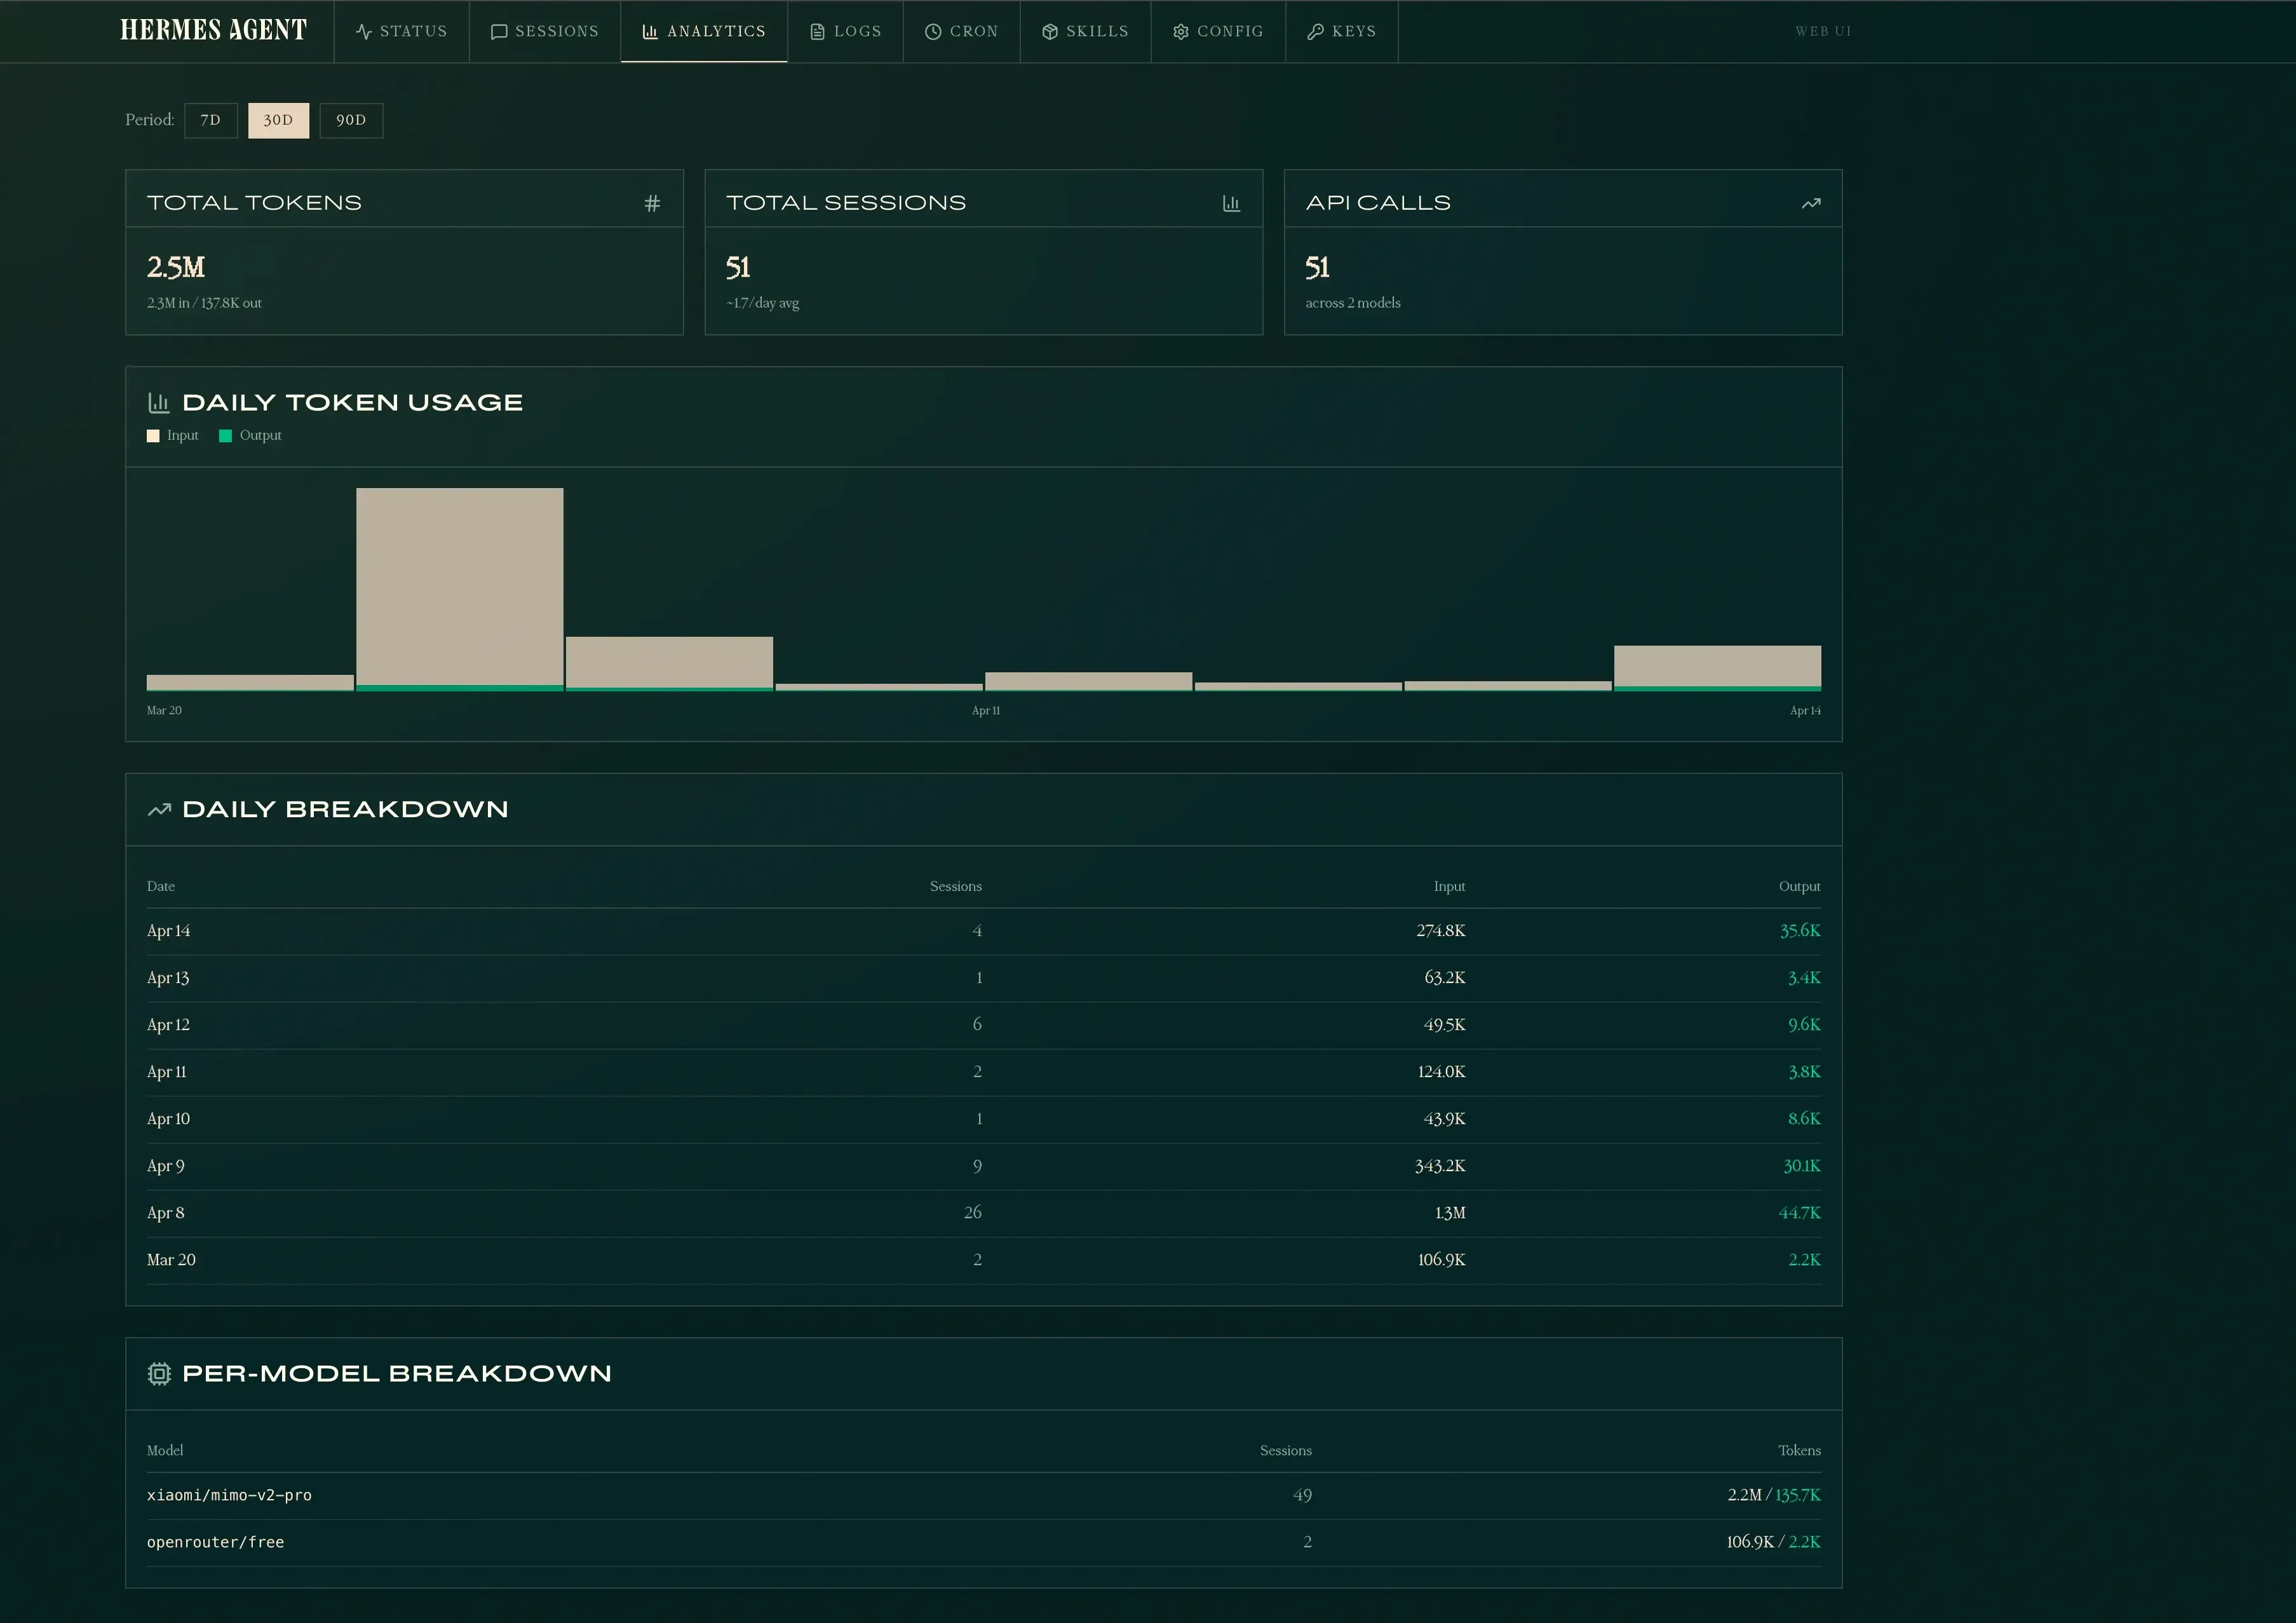
Analytics
The Analytics tab tracks token usage, session counts, and API calls over time. It shows daily breakdowns and per-model stats so you can see exactly how much your agent is costing.
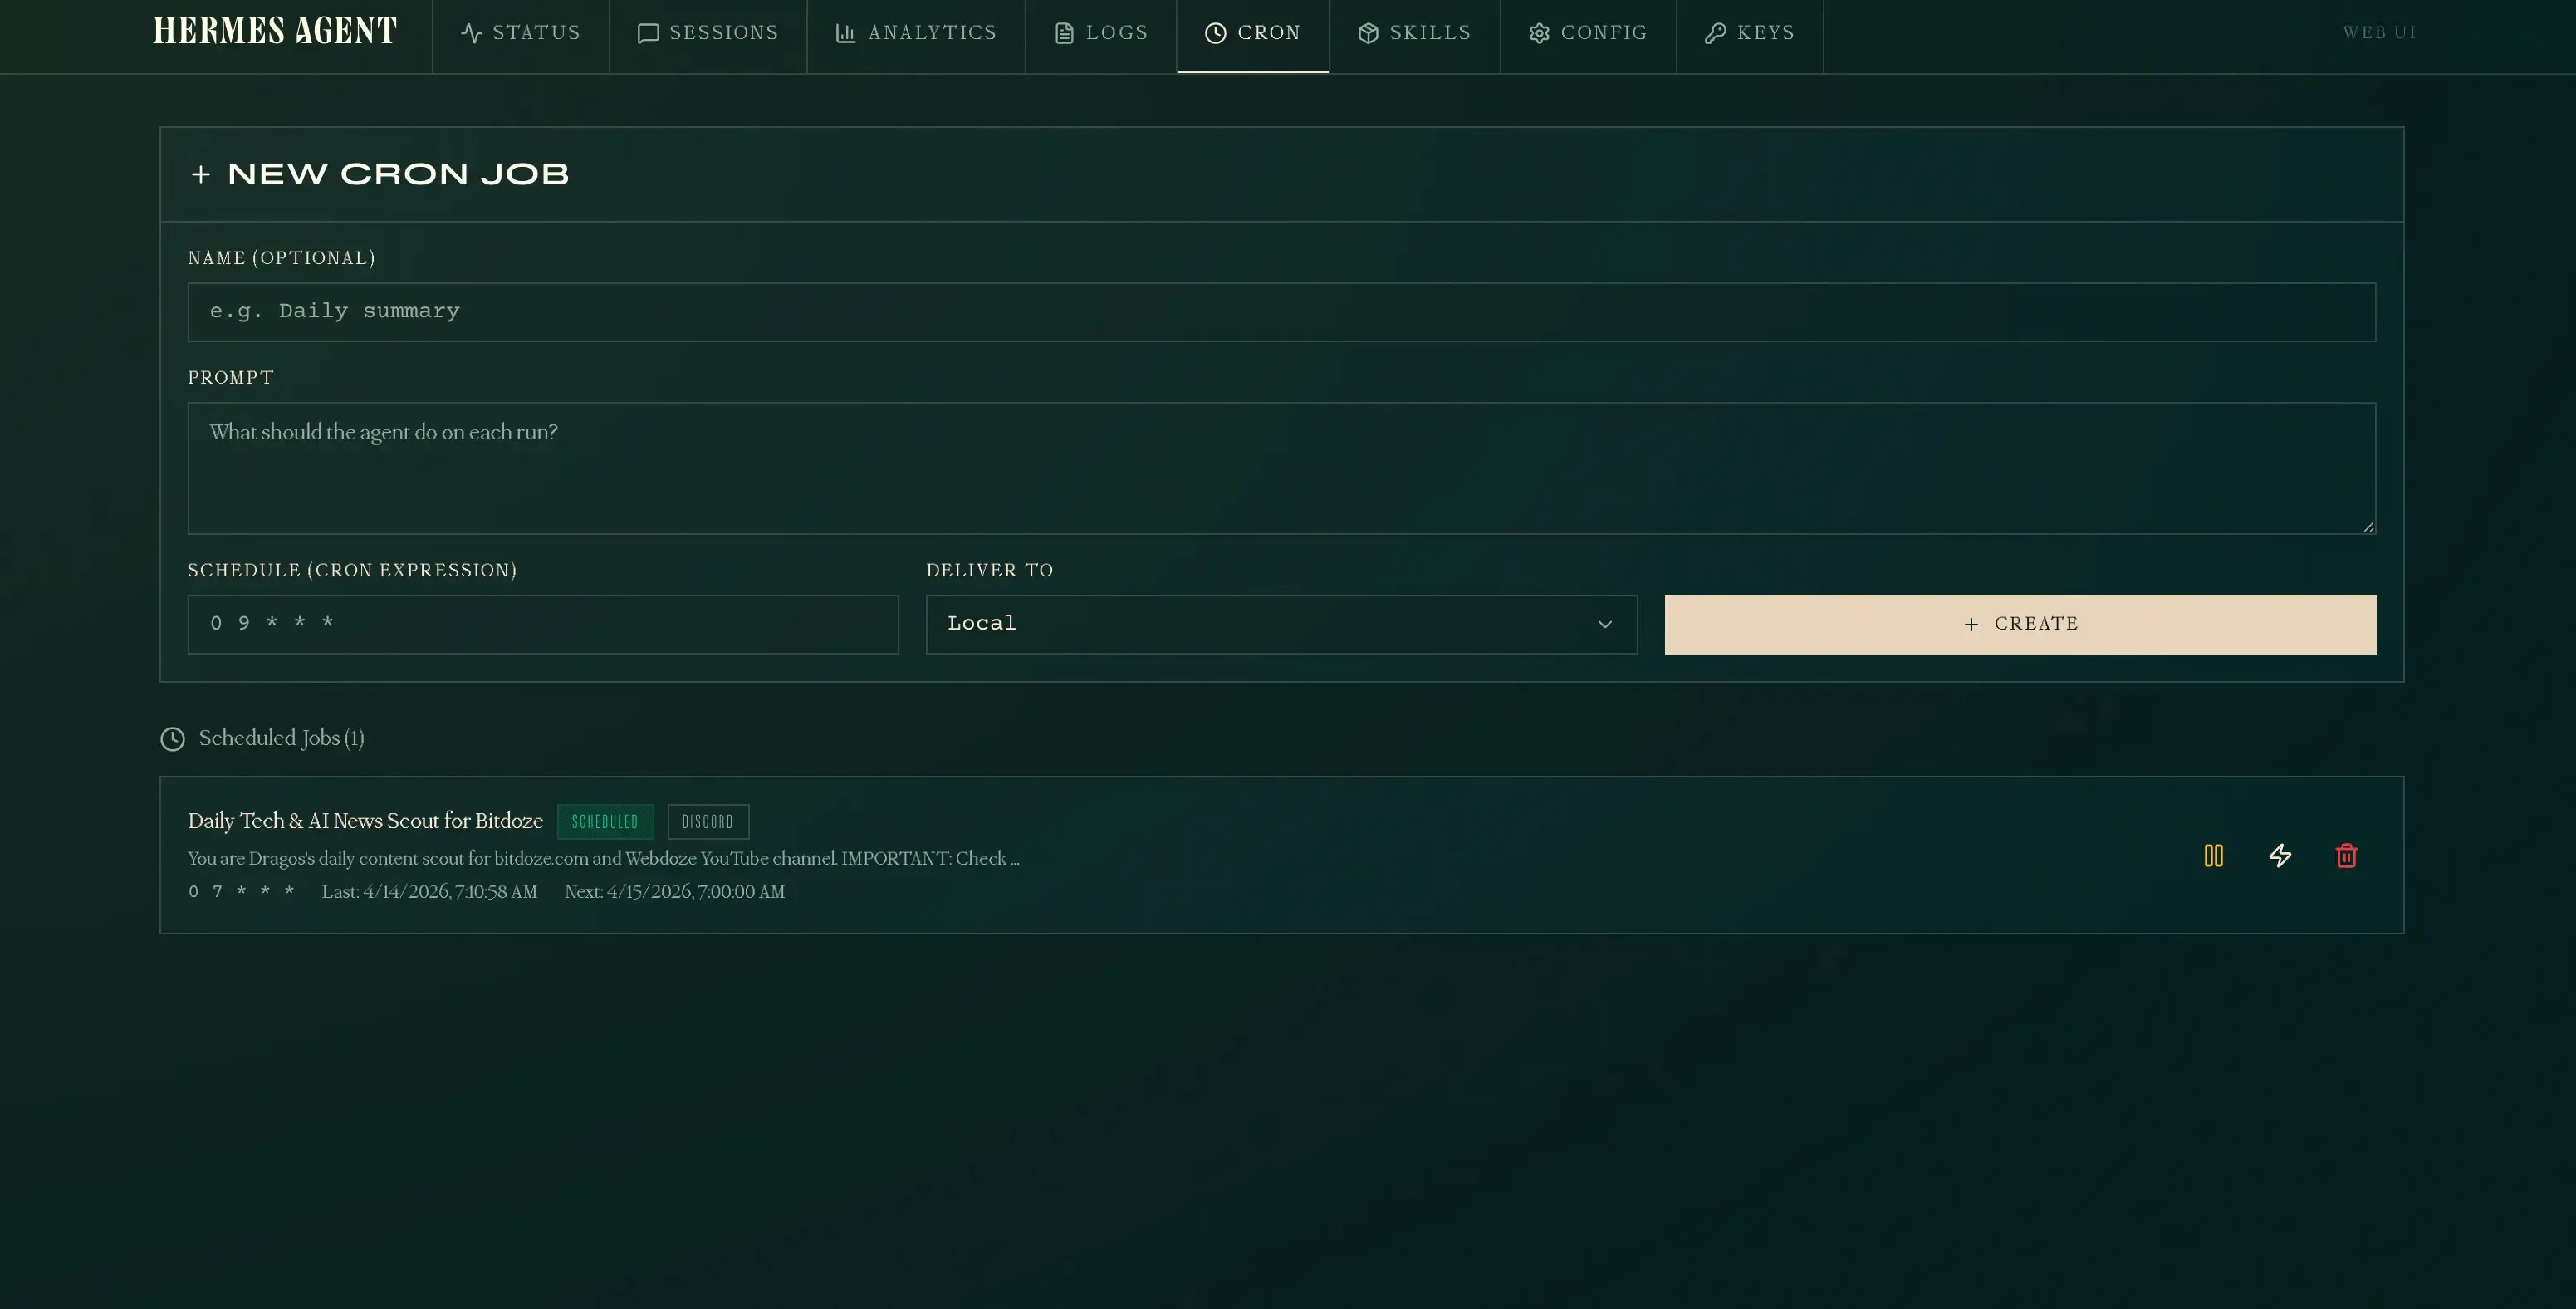
Cron
The Cron tab lets you create and manage scheduled tasks. You define a prompt, set a cron expression, and choose where results are delivered (local, Discord, etc.). You can pause, manually trigger, or delete jobs from here.
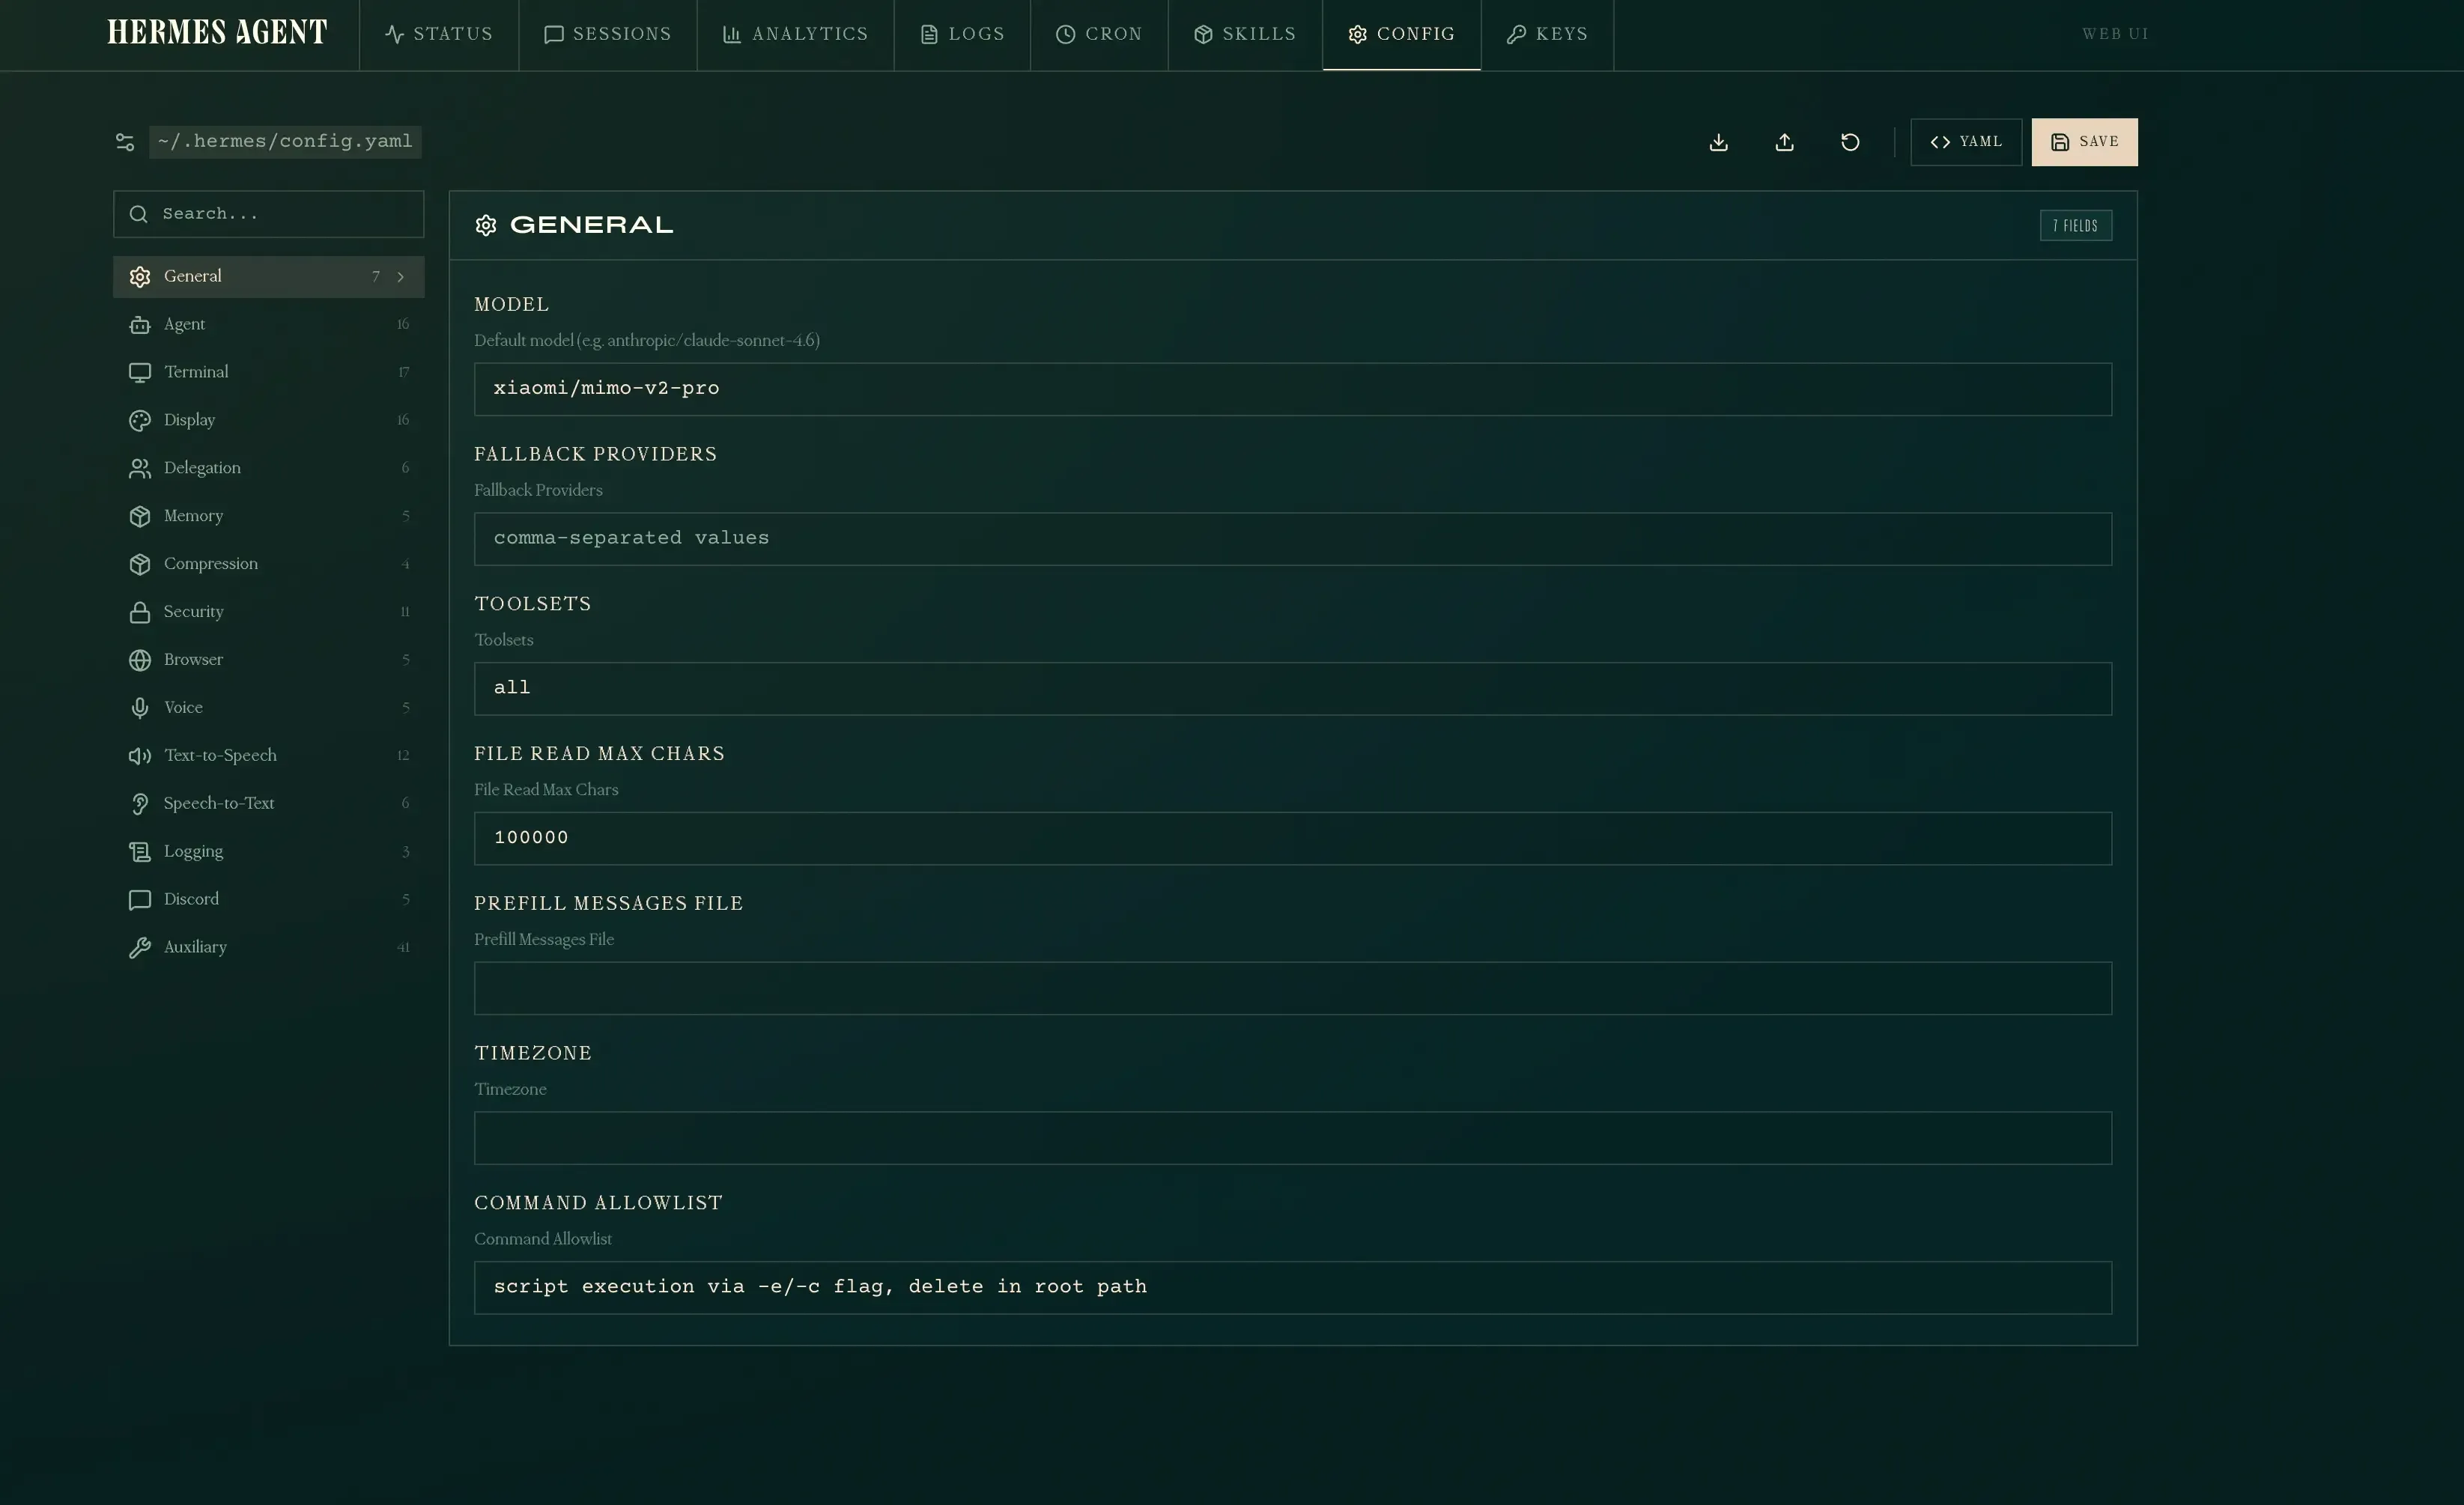
Config
The Config tab gives you a structured editor for ~/.hermes/config.yaml. It is organized by sections — General, Agent, Terminal, Display, Memory, Security, and more — each with labeled fields. You can edit values directly or toggle to raw YAML mode.
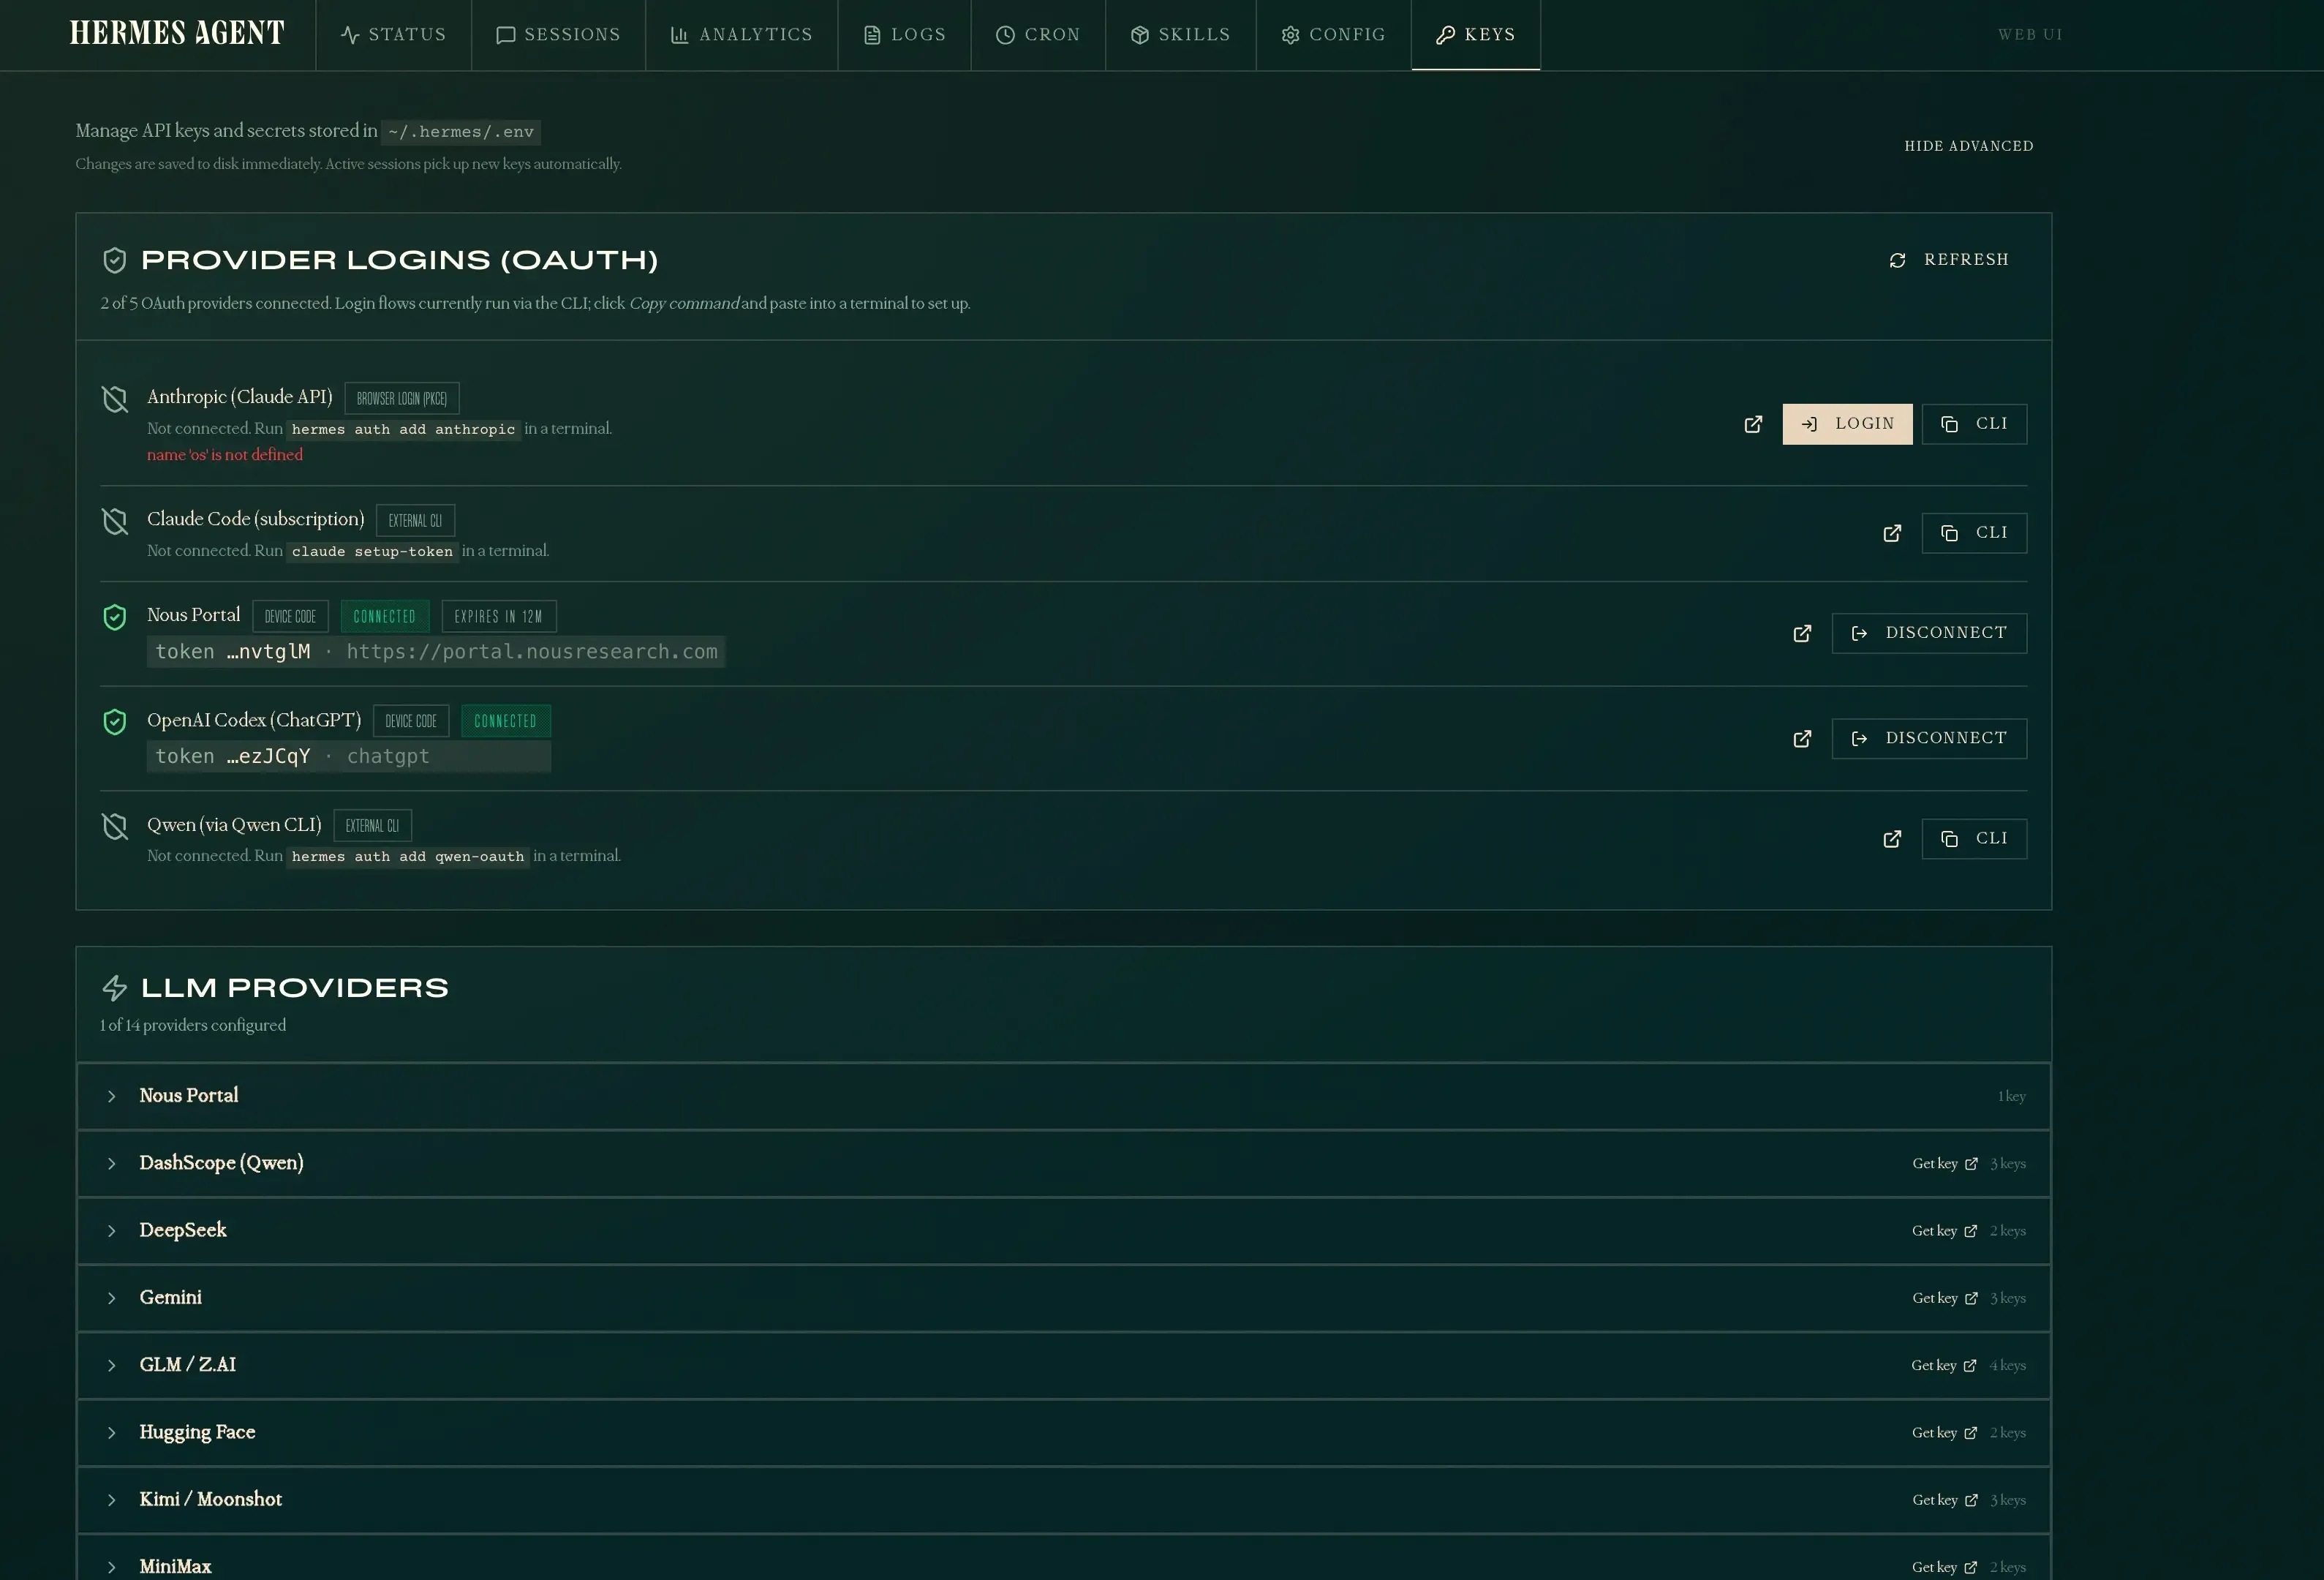
Keys
The Keys tab manages API keys and OAuth logins stored in ~/.hermes/.env. It shows which LLM providers are configured, handles OAuth flows (Nous Portal, OpenAI Codex), and lets you add or disconnect credentials without touching the command line.
Starting the dashboard
The simplest way to start:
hermes dashboardThis builds the web UI (first run only), then starts a server on http://127.0.0.1:9119. It will also open a browser tab if you are running it locally.
Available flags
| Flag | Default | Description |
|---|---|---|
--host | 127.0.0.1 | Interface to bind to |
--port | 9119 | Port to listen on |
--no-open | off | Skip automatic browser launch |
The default 127.0.0.1 binding means only your machine can reach the dashboard. That is the safe default — if you need remote access, keep reading.
Remote access via SSH port forwarding
If you just want to open the dashboard from your laptop while it runs on a VPS, SSH port forwarding is the simplest option. No reverse proxy, no DNS, no open ports on the server — everything goes through your existing SSH connection.
ssh -L 9119:127.0.0.1:9119 user@your-vps-ipThen open http://127.0.0.1:9119 in your browser on your laptop. The -L flag forwards your local port 9119 to the VPS’s localhost:9119 through the SSH tunnel. The dashboard sees it as a local connection.
This is the safest way to access the dashboard remotely because:
- The dashboard stays bound to
127.0.0.1— nothing else on the internet can reach it - Traffic is encrypted inside SSH — no extra TLS setup needed
- You already have SSH access, so there is nothing new to secure
- No open ports on the VPS beyond SSH
When to use SSH forwarding
Use this if you are the only person accessing the dashboard and you always connect from a machine with SSH access. Skip the Caddy and systemd sections entirely — just keep hermes dashboard running in a tmux or screen session.
Background SSH tunnel
If you want the tunnel to stay open in the background:
ssh -f -N -L 9119:127.0.0.1:9119 user@your-vps-ip-f— forks to background after authentication-N— no remote command, just the tunnel
To kill it later:
# Find the process
ps aux | grep "ssh -f -N -L 9119"

# Kill it
kill <PID>
Keep the dashboard running on the VPS
With SSH forwarding, the dashboard still needs to be running on the VPS. Use tmux or screen so it survives SSH disconnections:
# On the VPS
tmux new -s hermes
hermes dashboard
# Ctrl+B then D to detach

# Later, reattach with
tmux attach -t hermes
If you want it running permanently even without SSH, use the systemd service described further below.
Exposing the dashboard externally
To access the dashboard from another machine (your phone, your laptop, or a teammate), you need two things: bind to all interfaces and put a reverse proxy in front.
Step 1: Bind to 0.0.0.0
hermes dashboard --host 0.0.0.0This makes the server listen on all network interfaces. On its own, this means anyone who can reach your server’s IP can access the dashboard — do not stop here.
Step 2: Reverse proxy with Caddy
If you are already running Caddy as a reverse proxy on your server, add a block like this to your Caddyfile:
hermes.yourdomain.com {
    reverse_proxy your-server-ip:9119
    encode gzip
    header {
        Strict-Transport-Security "max-age=31536000; includeSubDomains; preload"
        X-Content-Type-Options nosniff
        X-Frame-Options SAMEORIGIN
        X-XSS-Protection "1; mode=block"
    }
}
If your Caddy instance runs inside Docker and the dashboard runs on the host, use host.docker.internal instead of the IP address:
hermes.yourdomain.com {
    reverse_proxy host.docker.internal:9119
}
Host networking requirement
If the dashboard binds to 127.0.0.1 (the default), Docker containers cannot reach it through host.docker.internal. You must either use —host 0.0.0.0 or run Caddy on the host directly (not in Docker).
Then reload Caddy:
sudo docker exec caddy caddy reload --config /etc/caddy/CaddyfileOr if Caddy runs on the host:
sudo systemctl reload caddyAdding password protection
The Hermes dashboard itself does not have a built-in password feature. But since it sits behind Caddy, you can use HTTP Basic Auth at the proxy level. This adds a browser login prompt before anyone reaches the dashboard.
Generate a password hash
Caddy stores passwords as bcrypt hashes. Generate one:
caddy hash-password --plaintext 'your-password-here'Or inside a Dockerized Caddy:
sudo docker exec caddy caddy hash-password --plaintext 'your-password-here'This outputs a hash string starting with $2a$....
Update the Caddyfile
Add a basic_auth directive inside the site block:
hermes.yourdomain.com {
    basic_auth {
        yourusername $2a$14$...your-hash-here...
    }
    reverse_proxy host.docker.internal:9119
    encode gzip
    header {
        Strict-Transport-Security "max-age=31536000; includeSubDomains; preload"
        X-Content-Type-Options nosniff
        X-Frame-Options SAMEORIGIN
        X-XSS-Protection "1; mode=block"
    }
}
Replace yourusername and the hash with your own. You can add multiple username-hash pairs for different users.
Verify it works
Without credentials — expect 401:
curl -sk -o /dev/null -w "%{http_code}" https://hermes.yourdomain.com/
# 401
With credentials — expect 200:
curl -sk -o /dev/null -w "%{http_code}" -u yourusername:your-password-here https://hermes.yourdomain.com/
# 200
When you open the URL in a browser, you will see a login popup before the dashboard loads.
Block direct access to port 9119
With Caddy handling authentication and TLS on port 443, there is no reason to let anyone reach port 9119 directly. If someone discovers your server’s IP address, they could bypass Caddy and hit the dashboard on port 9119 without any password. Block it with iptables:
# Allow Docker/Caddy internal traffic first
sudo iptables -A INPUT -p tcp --dport 9119 -s 172.16.0.0/12 -j ACCEPT

# Block everything else
sudo iptables -A INPUT -p tcp --dport 9119 -j DROP
The Docker allow rule is critical
If you only block 9119 without allowing Docker traffic first, Caddy will also be blocked. Caddy connects to the dashboard through Docker’s internal network (172.16.0.0/12 range). The ACCEPT rule must come before the DROP rule — iptables processes rules in order.
Verify the rules are in place:
sudo iptables -L INPUT -n | grep 9119
# ACCEPT  tcp  --  172.16.0.0/12  0.0.0.0/0  tcp dpt:9119
# DROP    tcp  --  0.0.0.0/0      0.0.0.0/0  tcp dpt:9119
This blocks all external connections to 9119 while letting Caddy reach the dashboard internally.
Persist the rule across reboots
iptables rules are lost on reboot by default. Save them:
sudo iptables-save | sudo tee /etc/iptables/rules.v4
If the file does not exist, install iptables-persistent first: sudo apt install iptables-persistent
If you are using ufw instead of raw iptables:
sudo ufw deny 9119/tcpRunning permanently with systemd
The hermes dashboard command runs in the foreground. If you close your terminal, it stops. To keep it running permanently, create a systemd service.
Create the service file
sudo tee /etc/systemd/system/hermes-dashboard.service << 'EOF'
[Unit]
Description=Hermes Agent Dashboard
After=network.target

[Service]
Type=simple
User=dragos
ExecStart=/home/dragos/.hermes/hermes-agent/venv/bin/python -m hermes_cli.main dashboard --host 0.0.0.0 --port 9119 --no-open
Restart=on-failure
RestartSec=5
Environment=HOME=/home/dragos

[Install]
WantedBy=multi-user.target
EOF
Adjust User and the Python path to match your setup. You can find the exact path with:
which hermes
# or
readlink -f $(which hermes)
Enable and start
sudo systemctl daemon-reload
sudo systemctl enable hermes-dashboard
sudo systemctl start hermes-dashboard
sudo systemctl status hermes-dashboard
Check logs
sudo journalctl -u hermes-dashboard -fRunning in Docker
If you prefer running the dashboard in a Docker container (consistent with how you deploy other services on the VPS), you can containerize it. The key constraint is that the dashboard needs to reach the Hermes gateway at 127.0.0.1:8642, so the container must use host networking.
Dockerfile
FROM python:3.12-slim

RUN pip install hermes-agent[web]

EXPOSE 9119

CMD ["python", "-m", "hermes_cli.main", "dashboard", "--host", "0.0.0.0", "--port", "9119", "--no-open"]
docker-compose.yml
services:
  hermes-dashboard:
    build: .
    container_name: hermes-dashboard
    network_mode: host
    restart: unless-stopped
network_mode: host is required because the gateway binds to 127.0.0.1:8642 — without it, the container cannot reach the gateway even with host.docker.internal.
With Caddy in the same stack
If you are running Caddy in Docker already (typical setup with a web external network), the dashboard container using network_mode: host is reachable from Caddy at host.docker.internal:9119. Add the Caddy block as described in the Caddy reverse proxy section above — no changes needed.
Build and run
docker compose up -d --buildCheck it is running
sudo docker ps --filter name=hermes-dashboard
curl -sk -o /dev/null -w "%{http_code}" http://127.0.0.1:9119/
Host networking and security
network_mode: host means the container shares the host’s network stack directly. The dashboard port is accessible on all interfaces — make sure Caddy or a firewall is in front if you expose it publicly.
Security risks
Exposing an AI agent dashboard to the internet is not the same as exposing a static website. Here is what you need to understand.
The dashboard is a control plane
Anyone with access to the dashboard can view sessions, read memory files, modify API keys, and change configuration. It is not just a read-only status page — it is full administrative access to your AI agent.
Basic Auth sends credentials in base64
HTTP Basic Auth encodes your username and password in base64 inside every request header. Without HTTPS, anyone sniffing your network can decode them instantly. Caddy provides automatic HTTPS with Let’s Encrypt, which solves this — but only if you use a real domain name, not a raw IP address.
Never expose without HTTPS
Do not run the dashboard on port 9119 with —host 0.0.0.0 without a TLS-terminating reverse proxy in front. Basic Auth over plain HTTP is essentially no auth at all.
Browser credential storage
Once you log in through Basic Auth, most browsers cache the credentials and send them automatically on every request to that domain. If someone gains access to your browser session (shared computer, browser exploit), they have free access to the dashboard.
No rate limiting by default
Neither the dashboard nor Basic Auth includes brute-force protection. An attacker can try thousands of passwords per minute. Consider adding fail2ban rules for your reverse proxy logs, or using Caddy’s forward_auth with a more robust auth provider if you need this.
IP allowlisting helps
If you always access the dashboard from the same IP (office, home), add firewall rules to restrict access:
# Allow only your IP
sudo ufw allow from YOUR_IP_ADDRESS to any port 443
sudo ufw deny 443
Or in Caddy, use a @blocked matcher:
hermes.yourdomain.com {
    @blocked not remote_ip YOUR_IP_ADDRESS/32
    respond @blocked "Forbidden" 403

    basic_auth {
        yourusername $2a$14$...
    }
    reverse_proxy host.docker.internal:9119
}
The dashboard talks to the gateway
The dashboard communicates with the Hermes gateway API at 127.0.0.1:8642. If someone compromises the dashboard, they also have indirect access to the gateway — which controls the agent that can execute terminal commands on your server. Treat the dashboard as a privileged surface, not a convenience feature.
Summary of risks
| Risk | Severity | Mitigation |
|---|---|---|
| Dashboard exposed without HTTPS | Critical | Always use Caddy with TLS |
| Port 9119 open to the internet | Critical | Block with iptables (see above) |
| Weak or reused password | High | Generate a strong random password |
| No brute-force protection | Medium | Add fail2ban or IP allowlisting |
| Browser caches credentials | Medium | Use private browsing on shared machines |
| Dashboard gives gateway access | High | IP restrict + strong auth + monitor logs |
Quick reference
# Local only (safe default)
hermes dashboard

# SSH tunnel (remote access, safest)
ssh -L 9119:127.0.0.1:9119 user@your-vps-ip
# Then open http://127.0.0.1:9119 on your laptop

# Remote access (bind to all interfaces)
hermes dashboard --host 0.0.0.0

# Custom port
hermes dashboard --host 0.0.0.0 --port 3000

# With systemd (permanent)
sudo systemctl start hermes-dashboard

# With Docker
docker compose up -d --build

# Check it is running
curl -sk -o /dev/null -w "%{http_code}" https://hermes.yourdomain.com/
For more on Hermes Agent setup, messaging integration, and skills, see the Hermes Agent setup guide and the MIMO V2 Pro integration guide. For the best third-party dashboards and web UIs beyond the built-in one, see the best Hermes dashboards roundup. For affordable model recommendations for Hermes Agent, see the best cheap models for Hermes Agent guide. For structured multi-agent task management with visual boards, the Hermes Kanban setup guide covers Kanban task boards, dependencies, and coordination patterns.
More AI tool guides

